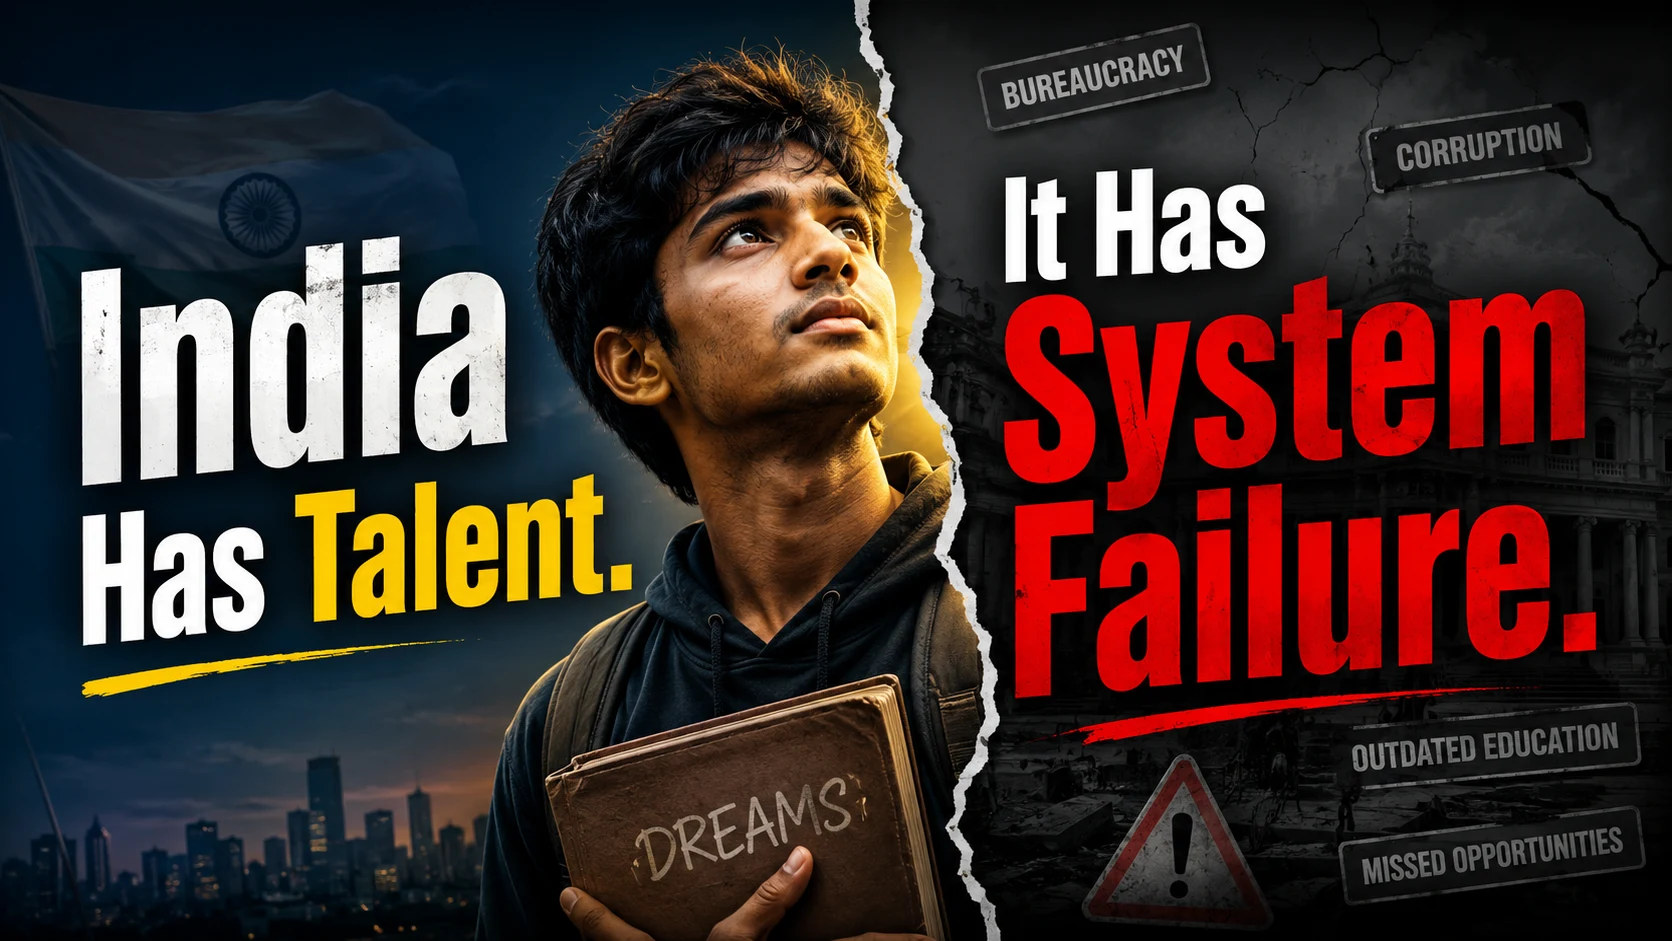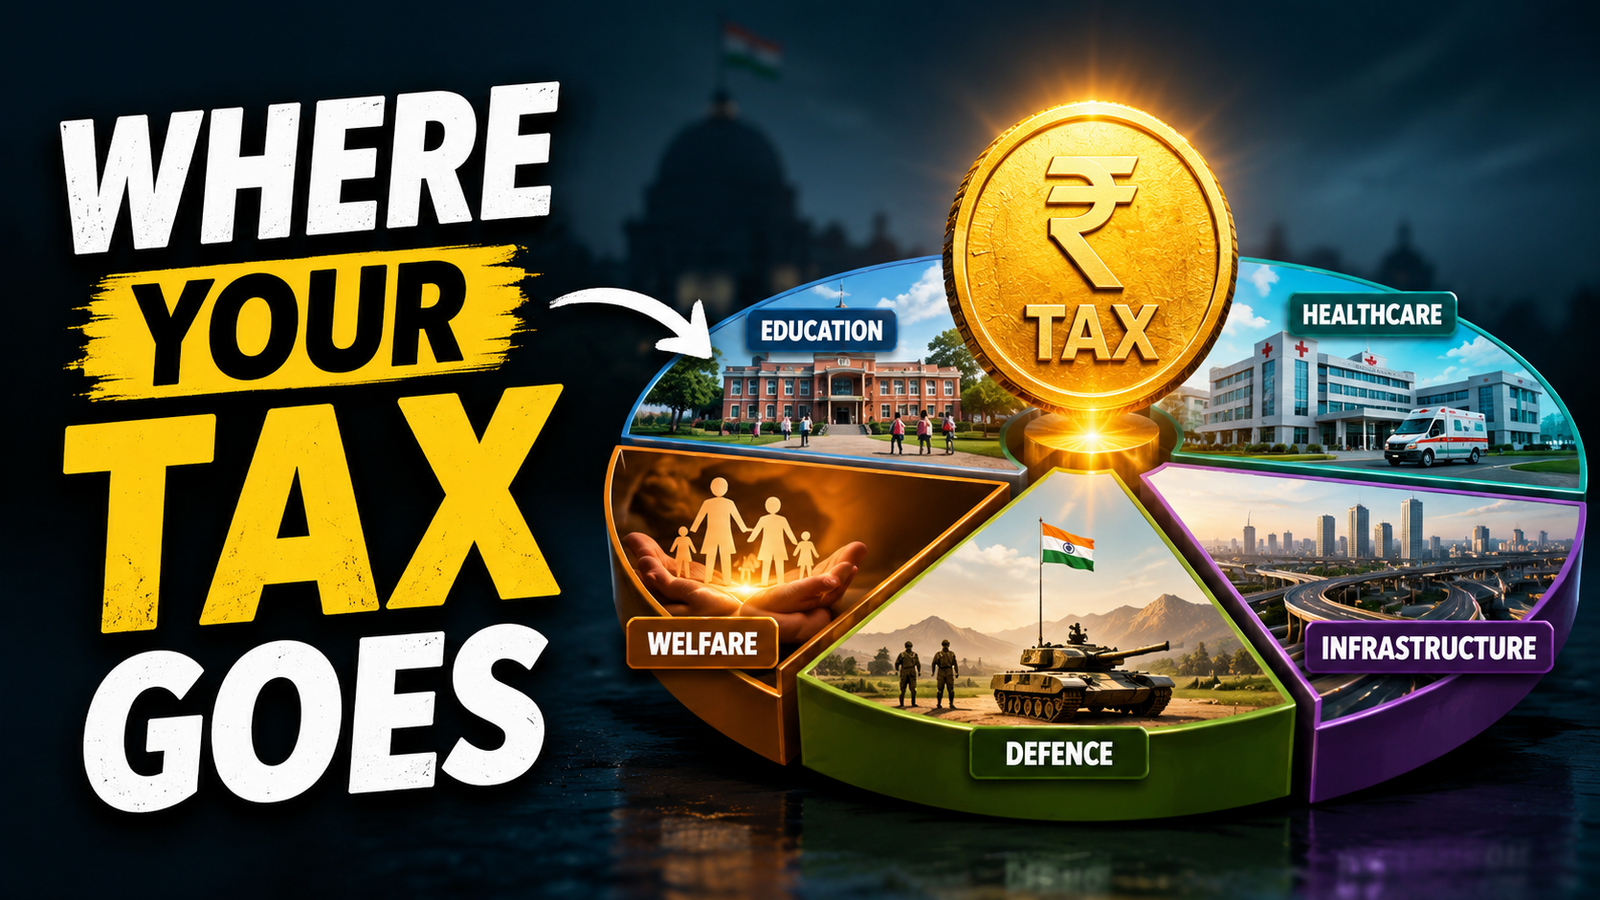
Every July, millions of salaried Indians log into the income tax portal, surrender a significant chunk of their earnings, and invariably ask the same question: What are we getting in return?
It is a fair question. India’s gross tax collection has surged, consistently breaking previous records, with direct taxes and Goods and Services Tax (GST) forming the backbone of the national treasury. Yet, the everyday experience of the average taxpayer often involves navigating crumbling city roads, breathing polluted air, and relying on expensive private healthcare and education because public alternatives are perceived as inadequate.
To understand this disconnect, we must look beyond political rhetoric and examine the structural reality of the Indian budget. The truth about where your tax money goes is a story of towering debts, a massive infrastructure push, and the chronic underfunding of human capital.
The Anatomy of a Rupee
Before analyzing the efficiency of government spending, we have to look at the math. The Union Budget is not simply a pool of money waiting to be spent on schools and hospitals; the vast majority of it is already committed before the financial year even begins.
Explore the interactive flow below to see exactly how revenue is distributed across different sectors.
Key insight: The single largest expense for the Indian government isn’t defense, subsidies, or infrastructure — it is paying the interest on past borrowings.
1. The Burden of the Past: Interest Payments
Approximately 20% of every rupee the government spends goes entirely toward servicing debt. Decades of fiscal deficits mean the government has to borrow heavily to fund its operations. Consequently, a massive chunk of your income tax does not build new assets; it merely pays the interest on money borrowed by previous and current administrations to keep the machinery running.
2. The Mandated Transfers: States’ Share
Another 20% is directly transferred to state governments as mandated by the Finance Commission. Therefore, if a taxpayer in Mumbai or Bengaluru is unhappy with local civic amenities, the accountability largely lies with the state and municipal governments, not just the central government. The center collects the bulk of the taxes, but the states are responsible for delivering the most visible public services: local roads, water, police, and sanitation.
The Two Indias: Capital Expenditure vs. Human Capital
When we look at the discretionary spending that remains, a stark philosophical choice becomes apparent. The current economic strategy heavily favors tangible asset creation over human development.
The Highway Boom
Over the last decade, capital expenditure (CapEx) has been the cornerstone of India’s economic policy. Tax money is aggressively funneled into building national highways, freight corridors, modernizing railway stations, and expanding airports.
This infrastructure push is highly visible and economically vital. Better logistics lower the cost of doing business, attract foreign investment, and create construction jobs. When the government points to where your tax money is going, they point to these mega-projects.
The Social Sector Squeeze
However, this physical infrastructure boom contrasts sharply with the state of public social infrastructure. India historically spends a remarkably low percentage of its GDP on public healthcare and education compared to other major economies.
While the upper and middle classes opt out of the public system entirely, the majority of the population is left to navigate severely overburdened facilities.
This creates a “taxpayer’s paradox.” A middle-class citizen pays high direct taxes and GST, yet still has to pay out-of-pocket for private health insurance, private schooling, private security (in residential complexes), and private water tankers. They are effectively taxed twice—once by the state, and once by the necessity of replacing failing public services with private alternatives.
Institutional Inefficiency and the “Leaky Bucket”
Even when funds are allocated to the right sectors, institutional inefficiency frequently diminishes their impact. The journey of a taxpayer’s rupee from the treasury to the ground is fraught with systemic friction:
- Bureaucratic Bottlenecks: Funds allocated for urban development or rural welfare often remain unspent due to complex procurement rules and lack of state-level capacity.
- Corruption and Leakage: While direct benefit transfers (DBT) have drastically reduced the theft of welfare funds by eliminating middlemen, infrastructure and municipal contracts remain highly susceptible to localized corruption.
- Misplaced Priorities: Municipal budgets are frequently spent on superficial beautification projects rather than deeply necessary—but invisible—upgrades like underground drainage or sewage treatment.
Conclusion: Fixing the Contract
The narrative that “only 2% of Indians pay tax” is a statistical half-truth. While it is true that a small percentage pays income tax, every citizen who buys a bar of soap, a liter of petrol, or a data pack pays indirect taxes (GST and excise). The burden of funding the state is borne by everyone.
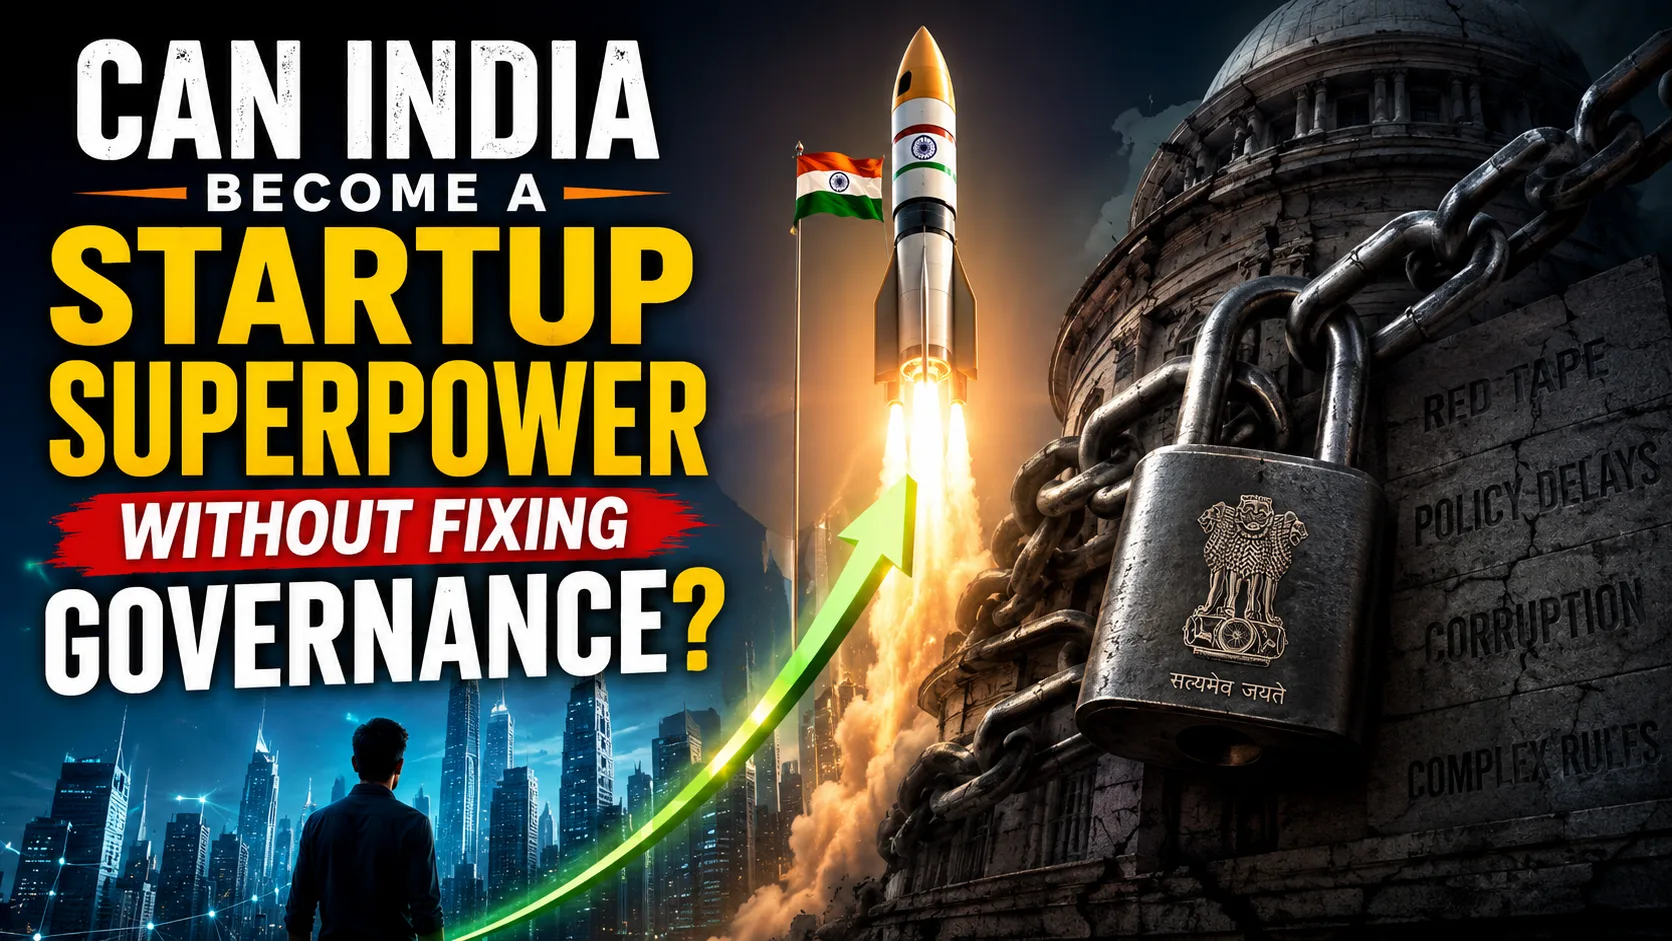
India’s tax collection system has modernized rapidly, becoming highly efficient at extracting revenue. However, the state’s capacity to deliver high-quality, everyday public services has not evolved at the same pace.
To fix this, the conversation must shift from simply widening the tax base to demanding institutional accountability for how funds are deployed at the municipal and state levels. Until local governance is reformed and human capital is prioritized alongside physical infrastructure, the Indian taxpayer will continue to fund a first-world treasury while navigating a developing-world reality.