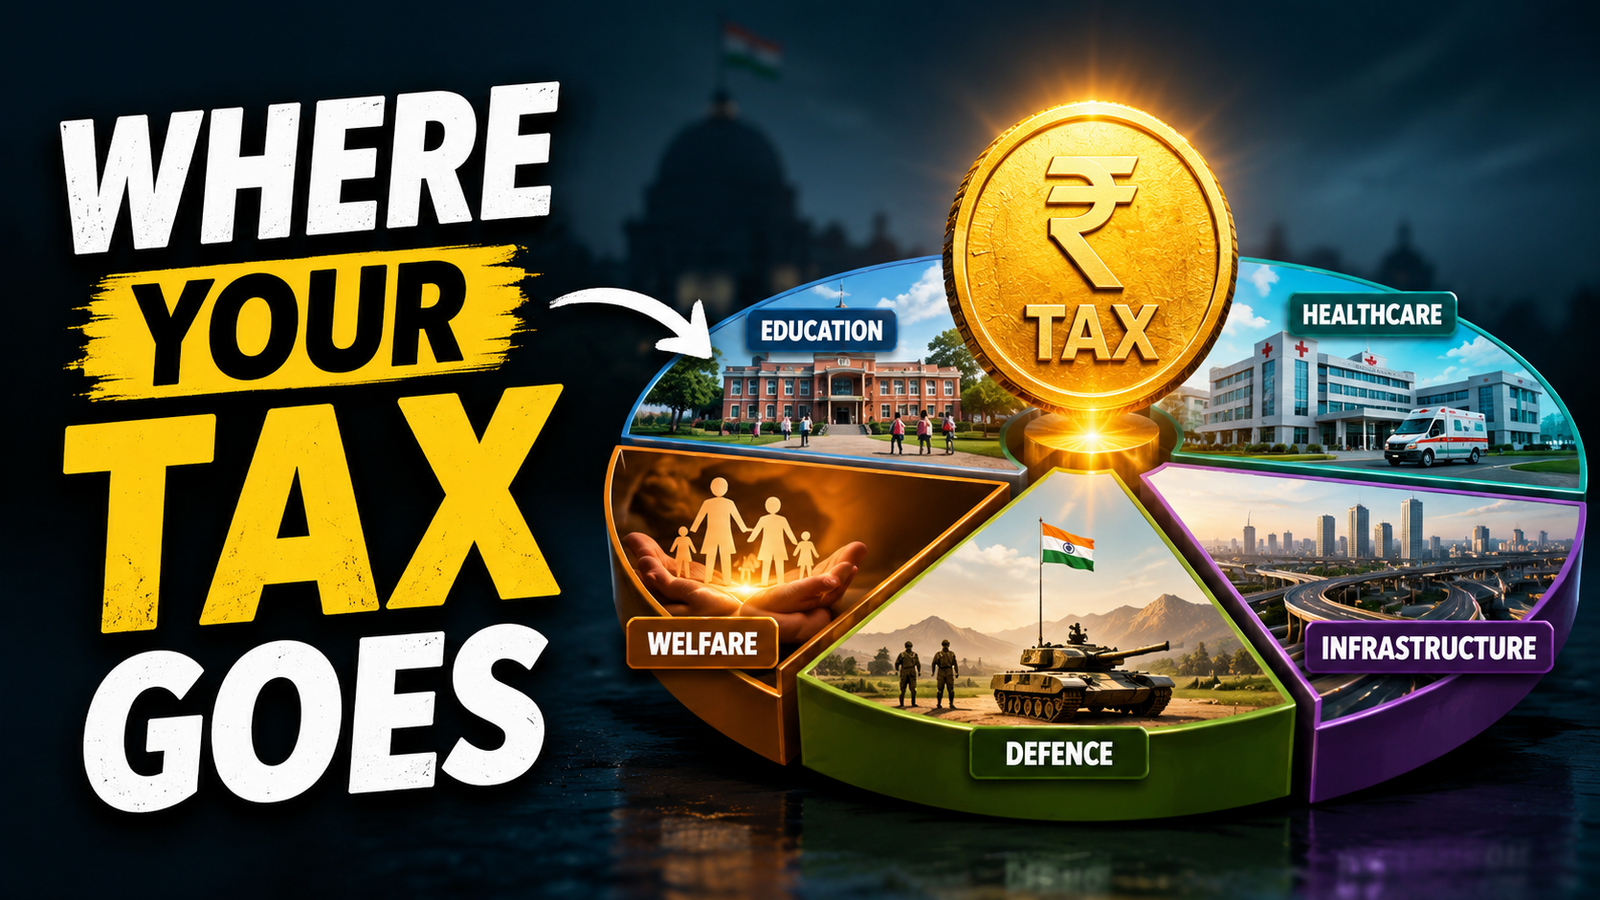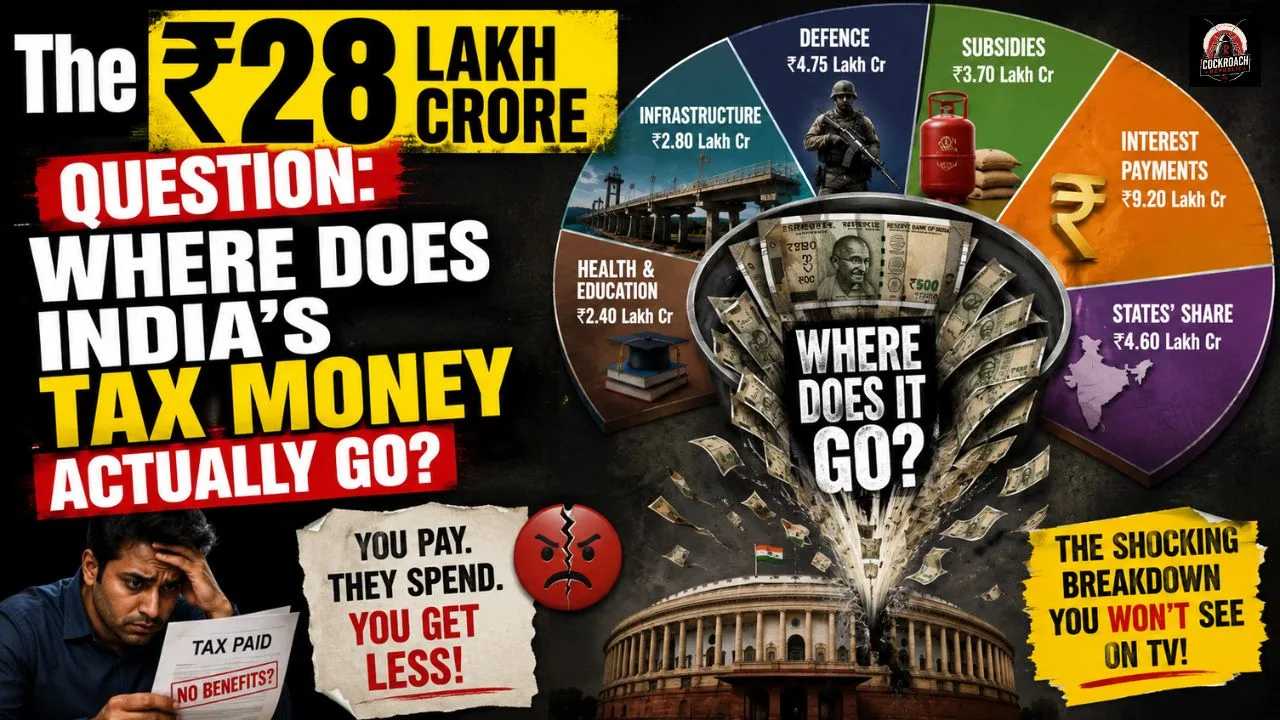
Every year, Indian taxpayers contribute over ₹28 lakh crore to the central exchequer. For the average citizen navigating congested roads, underfunded public schools, or overburdened state hospitals, the fundamental question remains: where exactly does this immense pool of wealth go?
The public narrative surrounding national expenditure is often clouded by political rhetoric. One side claims the treasury is drained by populist subsidies, while the other insists it is being entirely poured into massive infrastructure projects. The structural reality, buried within the Union Budget 2025-26 and historical expenditure data, reveals a far more constrained and complex picture.
This investigation breaks down the true anatomy of India’s tax expenditure, bypassing ideological narratives to examine the institutional realities of how public money is deployed.
The Big Picture: Dissecting the ₹100 Expenditure
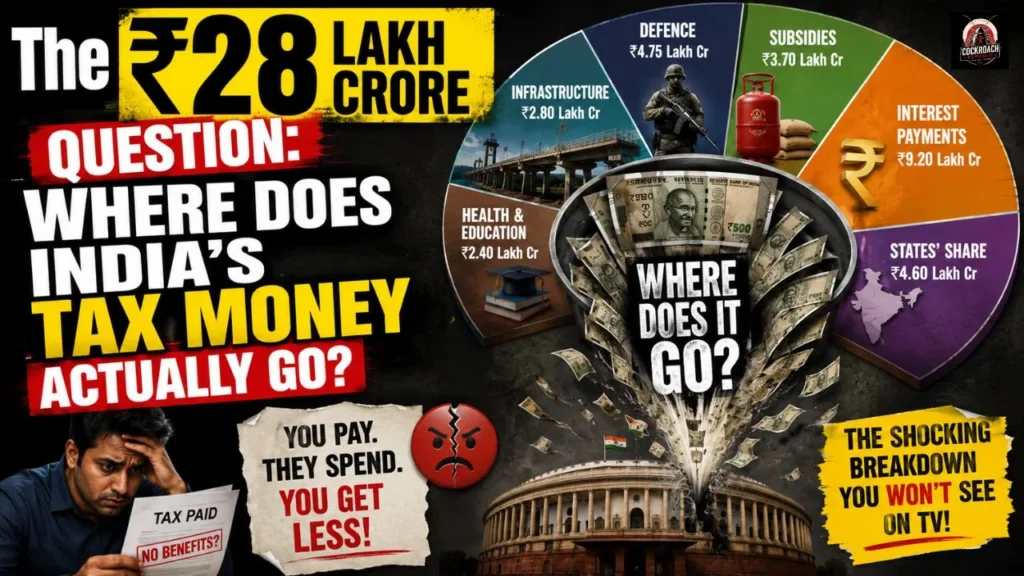
To understand the scale of national spending, it is easiest to look at how every single ₹100 of central government revenue is allocated. According to official budget documents, the expenditure is rigidly structured:
| Expenditure Category | Allocation | Primary Function |
| States’ Share of Taxes | 21% | Mandatory constitutional transfers for state governance |
| Interest Payments | 19–20% | Servicing accumulated historical debt |
| Central Sector Schemes | 16% | Fully Centre-funded welfare and development programs |
| Finance Commission Transfers | 9% | Additional grants for fiscal balancing among states |
| Other Expenses | 9% | Administrative and miscellaneous operational costs |
| Centrally Sponsored Schemes | 8% | Jointly funded programs like the National Health Mission |
| Defence | 8% | Armed forces modernization, operations, and salaries |
| Pensions | 6% | Retirement benefits for government and military personnel |
| Subsidies | 4–6% | Food, fertilizer, and fuel price support |
When analyzing these figures, three major claims dominate the national treasury.
1. The Burden of the Past: Interest Payments (19–20%)
The most uncomfortable fiscal truth in India is that roughly one-fifth of all tax revenue is consumed by interest payments on past government loans. This capital does not build new highways, fund universities, or equip the military—it merely services old debt.
In the 2025-26 fiscal year, a staggering ₹12.76 lakh crore is earmarked solely for interest payments. This represents 25% of total government spending and nearly 38.4% of total revenue receipts. The ratio of interest payments to revenue has steadily crept upward from 35% in FY17. The long-term consequence is clear: an increasing portion of modern tax revenue is locked into paying for the fiscal deficits of previous decades, severely limiting the government’s ability to fund contemporary development.
2. Fiscal Federalism: States’ Share (21%)
The single largest chunk of central tax collection—21 paise out of every rupee—never stays in New Delhi. Under India’s constitutional framework of fiscal federalism, this money is directly devolved to state governments.
While the Centre collects income tax, corporate tax, and GST, states rely on this 21% share to fund critical grassroots infrastructure, local policing, and primary healthcare. When combined with the 9% mandated by the Finance Commission, almost 30% of the Centre’s revenue is transferred outward. Consequently, a vast portion of “central” taxation is actually functioning as the financial lifeblood of regional governments.
3. National Security: Defence (8%)
With an allocation of ₹6.81 lakh crore, the Ministry of Defence receives the highest funding among all individual ministries. However, a deeper institutional analysis reveals how this money is internally divided.
Approximately 45% of the defence budget is consumed by revenue expenditure, primarily salaries and daily operational costs. Another 23% is strictly dedicated to defence pensions. This leaves roughly 26% for actual capital outlay—the critical funding required to purchase modern equipment, aircraft, and technology. The challenge for policymakers is balancing the human cost of maintaining a massive standing army with the urgent need for technological modernization.
Debunking Expenditure Myths
Public perception regarding government waste often focuses on the wrong areas. Data reveals that several common assumptions are factually incorrect:
- The Subsidy Myth: Direct subsidies for food, fuel, and fertilizer account for only 4–6% of the budget. While historically higher, systemic reforms have significantly reduced this footprint.
- The Infrastructure Illusion: Despite high-visibility campaigns regarding capital expenditure, only about 15–20% of government spending directly creates new physical assets (roads, railways, ports). The vast majority of the budget remains categorized as revenue expenditure.
- The Education and Healthcare Deficit: There is no single, massive bucket for education or healthcare. Instead, these critical sectors are fragmented across various Central Sector and Centrally Sponsored Schemes, which collectively account for 24% of the budget.
ALSO READ Cockroach Janta Party: How a Courtroom Remark Ignited a 22-Million-Strong Youth Rebellion
The Silent Drain: Structural Inefficiencies
While the budget documents dictate where the money is supposed to go, institutional inefficiencies dictate where it is lost. Investigative data points to massive structural leakages that act as a shadow tax on the economy:
- Power Sector Losses: Aggregate Technical and Commercial (AT&C) losses—a combination of electricity theft, poor infrastructure, and billing failures—cost the exchequer an estimated ₹1.4 to ₹1.8 lakh crore annually.
- Welfare Leakages: Historically, Public Distribution System (PDS) leakages hovered around 41.7% in 2011–12, meaning nearly half of subsidized grain vanished into the black market. Today, the integration of biometric-linked Direct Benefit Transfers (DBT) has driven this leakage down to an estimated 8.8%, though billions of rupees are still lost in transit.
- The Shadow Economy: Unquantified tax evasion continues to constrain revenue. With the shadow economy estimated at 20–30% of India’s GDP, the burden of taxation falls disproportionately on a narrow base of formal salaried employees and compliant corporations.
ALSO READ India’s Political Dynasties: Do Powerful Families Still Shape the World’s Largest Democracy?
State-Level Efficiency: Who Spends It Better?
The effectiveness of tax deployment ultimately relies heavily on state-level governance. A 2026 fiscal analysis of three major states highlights vastly different approaches to public finance:
- Maharashtra: Generates 72–75% of its own revenue, indicating strong fiscal independence, but dedicates a moderate 13–14% to capital expenditure.
- Tamil Nadu: Maintains high revenue independence (65–70%) but struggles with high committed expenditures (salaries and pensions at 62%), leaving only 10–12% for new infrastructure.
- Uttar Pradesh: Relies heavily on central funds (generating only 45–50% of its own revenue) but aggressively channels 19–20% into capital expenditure to rapidly build infrastructure.
The Bottom Line
A rigorous examination of India’s tax expenditure reveals an uncomfortable reality for policymakers and citizens alike: the central government operates with highly restricted discretionary capital.
Before a single new school is funded or a new highway is approved, over 40% of all tax revenue is pre-committed to servicing historical debt and funding state governments. Subsidies, often the target of political debate, represent a minor fraction of the actual outflow.
The most pressing challenge for India’s economic future is not necessarily raising taxes, but escaping the compounding trap of debt servicing and plugging the billion-dollar leakages in power and public distribution. The true measure of the nation’s fiscal health isn’t just where the money goes—it’s how much of it actually translates into progress.
ALSO READ The Financial Literacy Gap: Why Indian Schools Fail to Teach Money Management